


Dynamic Boundary-Insensitive Loss for MR Medical Image Segmentation
Mingyan Qiu, Chenxi Zhang*, and Zhijian Song*
Medical Physics (2021, IF=4.071)
Abstract
Purpose: Deep learning method has achieved greatsuccess in MR medical image segmentation.One challenge in applying deep learning segmentation models to clinical practice is their poor generalization mainly due to limited labeled training samples, inter-site heterogeneity of different datasets, and ambiguous boundary definition, etc. The objective of this work is to develop a dynamic boundary-insensitive (DBI) loss to address this poor generalization caused by uncertain boundary.
Methods:The DBI loss is designed to assign higher penalties to misclassified voxels farther from the boundaries in each training iteration to reduce the sensitivity of the segmentation model to uncertain boundary. The weighting factor of the DBI loss can be adjusted adaptively without any manual setting and adjustment. Extensive experiments were conducted to verify the performance of our DBI loss and its variant, DiceDBI, on four heterogeneous prostate MRI datasets for prostate zonal segmentation and whole prostate segmentation.
Results: Experimental results show that our DBI loss, when combined with Dice loss, outperforms all competing loss functions in Dice similarity coefficient (DSC) and improves the segmentation performance across all datasets consistently, especially on unseen datasets and when segmenting small or narrow targets.
Conclusions:The proposed DiceDBI loss will be valuable for enhancement of the generalization performance of the segmentation model.
Paper Link:https://aapm.onlinelibrary.wiley.com/doi/10.1002/mp.15386
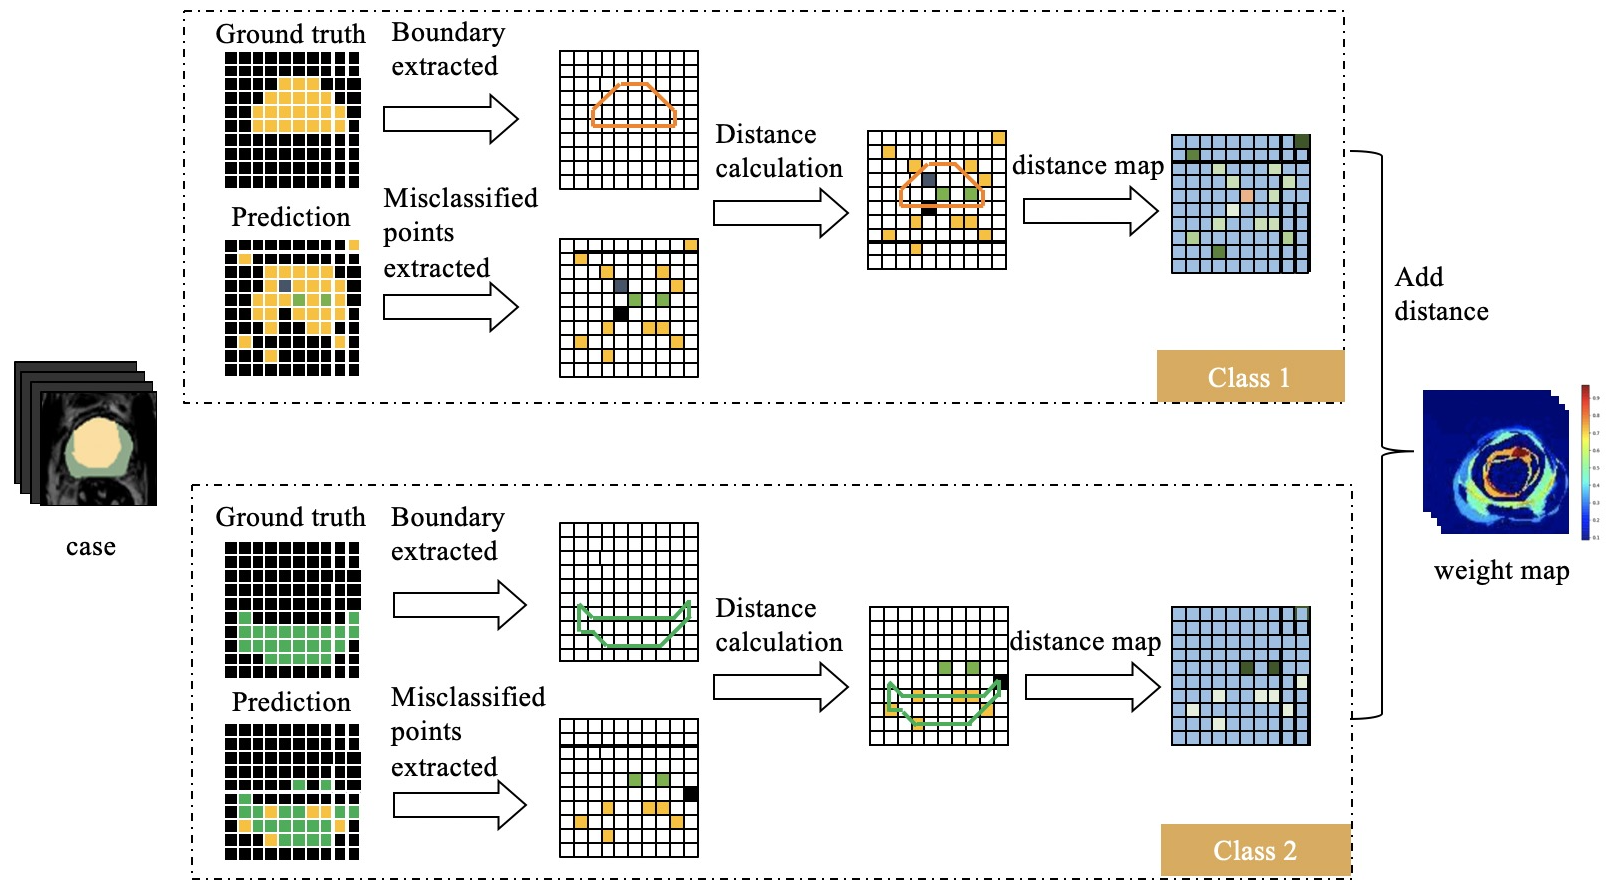
Fig. 1. DBI loss flow diagram. The yellow area, the green area and the black area represent class 1, class 2, and the background respectively. The distance map records the distance between the misclassified pixels and the contour. The weight map is presented in the form of a heat map.